Richest Cities in Vermont (2026)
by Kristen Carney
Updated: February 9, 2026
Richest City in Vermont
The richest city in Vermont is Searsburg in Bennington County with an average household income of $254,132 as of 2024. While exceptionally affluent, Searsburg only has a population of 129 as of 2024. The richest city in Vermont with at least 5,000 people is Shelburne in Chittenden County with an average household income of $168,867 as of 2024 and 7,969 people as of 2024 according to the most current Census data available (citation).
| Rank | City | County | Population | Average Income | Median Income |
|---|---|---|---|---|---|
| 1 | Searsburg | Bennington | 129 | $254,132 | $61,071 |
| 2 | Landgrove | Bennington | 225 | $201,357 | $195,938 |
| 3 | Dorset | Bennington | 2,092 | $195,167 | $111,250 |
| 4 | Norwich | Windsor | 3,640 | $189,389 | $140,313 |
| 5 | Old Bennington | Bennington | 182 | $189,044 | $168,750 |
| 6 | Charlotte | Chittenden | 3,916 | $183,392 | $144,375 |
| 7 | South Hero | Grand Isle | 1,586 | $179,827 | $127,434 |
| 8 | Peru | Bennington | 434 | $177,088 | $151,875 |
| 9 | Ripton | Addison | 508 | $175,347 | $112,917 |
| 10 | Warren | Washington | 1,585 | $174,518 | $86,905 |
| 11 | Shelburne | Chittenden | 7,969 | $168,867 | $115,963 |
| 12 | Morgan | Orleans | 827 | $160,251 | $91,250 |
| 13 | Woodstock town | Windsor | 3,027 | $159,059 | $120,938 |
| 14 | Cornwall | Addison | 1,208 | $158,912 | $114,583 |
| 15 | Hinesburg | Chittenden | 4,718 | $152,782 | $112,539 |
| 16 | Woodstock village | Windsor | 936 | $152,464 | $87,292 |
| 17 | St. George | Chittenden | 812 | $152,154 | $109,464 |
| 18 | Weston | Windsor | 685 | $150,099 | $115,000 |
| 19 | Waterbury | Washington | 5,405 | $149,365 | $103,917 |
| 20 | Andover | Windsor | 616 | $148,718 | $102,500 |
Median Income versus Average Income: Which Should You Use?
We usually suggest using median income data – either instead of or in addition to – average income data as a true indicator of wealth. If you haven’t thought about median versus average since your last standardized test, you aren’t alone. Here’s what they are:
- average is the sum of a set of numbers divided by the count of numbers in the set
- median is the middle number in the set of numbers
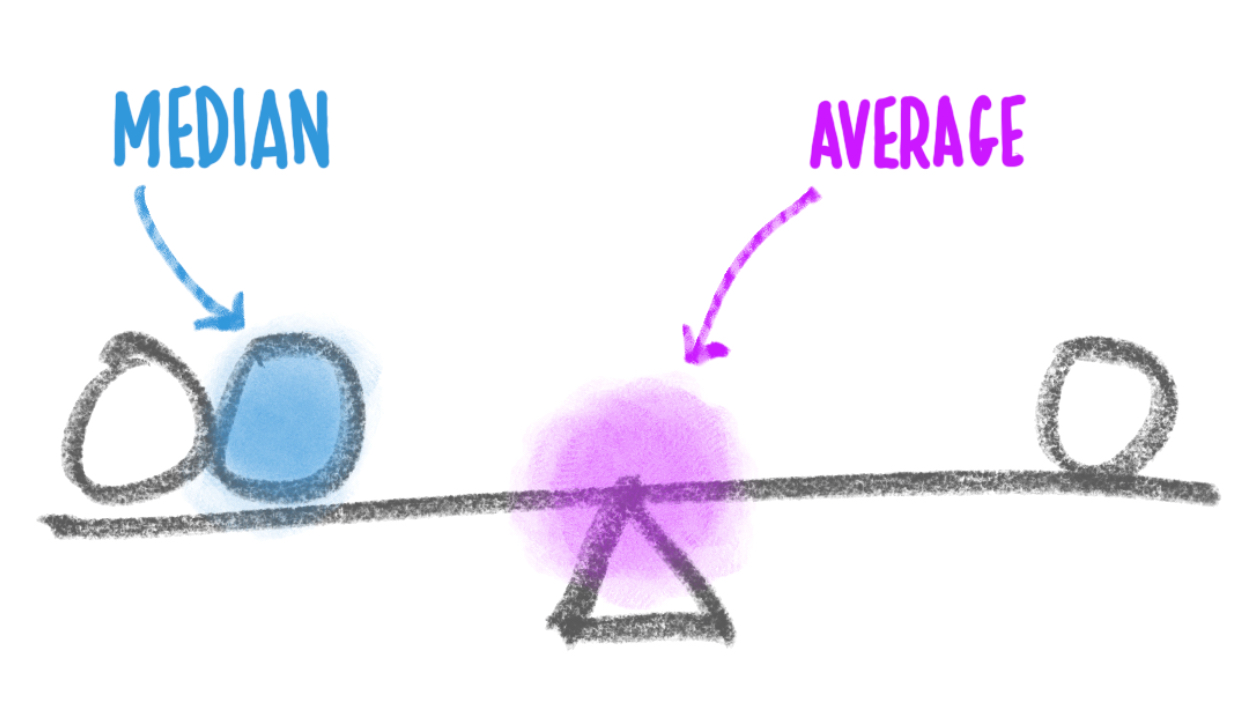
Now let’s say you had the following simplified set of income data.
Household 1: $30,000
Household 2: $50,000
Household 3: $1,000,000
The average income for this set is $360,000. The outlier data point ($1,000,000) skews the average WAY up. Conversely, the average income would be skewed WAY down if someone had an income of $500. The median income for the same data set is $50,000. Outlier data doesn’t skew the median.
Most Business Owners Should Use Median Income
So most business owners should use the median income as a true indicator of wealth, because it provides a more accurate representation of a typical income, especially in areas with significant income disparity.
When Should You Use Average Income
If your target market is high-income households, the average income may be more relevant. This is because the average income can highlight the presence of a higher concentration of wealthy individuals, which is beneficial for luxury goods and services marketing. We’re using average income on this page because using the Census’s highest reported median value of $250,001 could result in multiple ties for the richest geography.
Why do so many cities have a median value of $250,001?
The Census' American Community Survey uses $250,000+ as a jam value for median income estimates to protect privacy, ensure data consistency, and simplify reporting. A "jam value" in survey data refers to a placeholder or default value used when actual data points are unavailable, incomplete, or exceed certain thresholds. We represent this jam value as $250,001 to make it easy for you to sort.
You might also be interested in:
Email Me When New Data Are Released
Join thousands of subscribers and receive just 1 (ONE!) email a year in December when the US Census Bureau releases new income data for Vermont richest cities.
SOURCES
United States Census Bureau. Annual Estimates of the Resident Population: April 1, 2020 to July 1, 2023. U.S. Census Bureau, Population Division. Web. May 2024. http://www.census.gov/.
United States Census Bureau. B01001 SEX BY AGE, 2024 American Community Survey 5-Year Estimates. U.S. Census Bureau, American Community Survey Office. Web. 29 January 2026. http://www.census.gov/.
United States Census Bureau. B19013 Median Household Income, 2024 American Community Survey 5-Year Estimates. U.S. Census Bureau, American Community Survey Office. Web. 29 January 2026. http://www.census.gov/.
United States Census Bureau. "DP03 SELECTED ECONOMIC CHARACTERISTICS." 2024 American Community Survey 5-Year Estimates. U.S. Census Bureau, American Community Survey Office. Web. 29 January 2026. http://www.census.gov/.
Products & Services
Plumbing
Connect
- 1-800-939-2130
- Contact Us
© Copyright 2026 Cubit Planning, Inc.